Author: Kenneth Kitahata, Manager of Data & Analytics
Pacific Community Ventures (PCV) is a 501(c)(3) nonprofit impact investor and community development financial institution (CDFI). In 2022, our integrated “loan + advice” model deployed $9M in loans and helped 2000+ BIPOC, women, and other underestimated small business owners create good jobs with dignity, address racial and gender wealth gaps, and build community wealth. This year PCV is excited to launch the Good Jobs Innovation Lab, a new internal research and policy function aimed at designing and testing new products and services that improve job quality outcomes in our small businesses.
At PCV’s new Good Jobs Innovation Lab, we know how important it is for organizations working towards positive social impact to understand the effectiveness of their efforts. That’s why we’re excited to start the new year with a new technical tool to help us achieve our mission: deploying restorative capital to entrepreneurs of color, creating “good jobs” for entrepreneurs and their employees, and breaking down systemic barriers that perpetuate racial and gender wealth gaps. Our modern, cloud-based warehouse and ETL tool allows us to standardize data across teams and house all client information in one place. The road to digital transformation was a learning journey for PCV, and we’re eager to share three lessons learned using data analytics to close the racial wealth gap:
- Successful digital transformation puts mission and people ahead of technology
Implementing Snowflake and Matillion to automate data storage and modeling allowed us to compare clients across our programs – not just within program siloes – and better understand the entire client journey as they are served by PCV. Previous efforts to standardize data in Salesforce fizzled out as few staff used the tool. Instead, we began this revamp with deep listening and user research to understand the existing hosted applications the team used like loan servicing software and our technical assistance platform. It was clear our “loans + advice” approach to serving our clients was core to the PCV mission, so we began to focus on a way to combine all our client data into a single source of truth. Instead of allowing a tech stack to force us to change how we work, we allowed our mission and existing process to drive tool selection and vendor choice. A high-functioning data-driven culture prioritizes business process alignment, improves decision-making capability, and ensures robust change management strategy is in place.
- PCV’s internal Data Revamp Working Group set us up for success.
Going into the data revamp we knew a key risk was user adoption, so we launched an internal, 10-member Data Revamp Working Group to ensure our end solution met each team’s needs. We defined user stories for stakeholders across PCV, from a Credit Analyst underwriting loans to our Marketing Director tracking referral sources. This groundwork saved time and money during our discovery process by mapping PCV’s systems internally. While many data consultants will conduct this inventory, it was a useful exercise for PCV to do itself to unearth redundant systems or ones that overlap too much. There is the added benefit of better understanding internal process flows once you visualize the entire map in one view – data bottlenecks become more apparent, and areas where data are not speaking to each other (but should be) also becomes clear. Our Working Group set us up for success with internal adopters by tackling the human element of digital transformation, bringing along stakeholders through each step of the engagement and incorporating their feedback. This group of leaders will continue to be an important forum for our next step of capacity building in Tableau to foster a self-serve data culture.
- Better storytelling around racial justice impact.
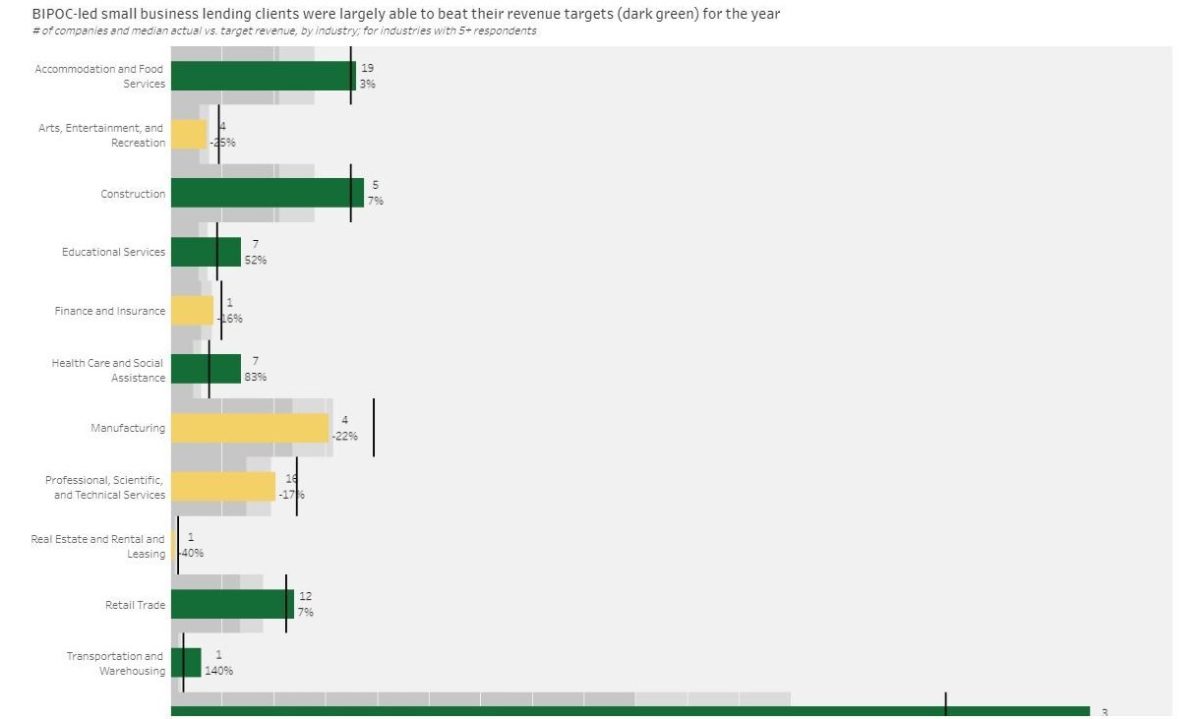
Deploying Tableau Dashboards has allowed PCV powerful data storytelling around racial equity outcomes and promoting good jobs. To accompany PCV’s 2021 Social Impact Report, we used the Storyboard feature in Tableau to visualize our impact for funders, partners, and staff. For instance, one chart showed BIPOC-led small business clients were largely able to beat their revenue targets for the year. Segmenting by industry, we’re able to see our largest category of Accommodation and Food Services achieved $720,000 median revenue, surpassing their median desired revenue of $700,000. As one measure of the racial wealth gap, it demonstrates PCV’s ability to racially disaggregate data and zoom in beyond a finding like three quarters of entrepreneurs said PCV’s support tangibly contributed to their success. Additionally, Tableau has streamlined business intelligence for our program teams. Connecting live data, automatically cleaned data from Snowflake to Tableau has given staff a new window into fund management, tracking referrals, and measuring the degree to which our integrated model affects business outcomes.

We recognize that we are not the only ones undergoing data transformation as a CDFI. In light of this, we are evaluating the potential for creating a learning community to support others in this process. If you are interested in learning more about data governance and data visualization for impact, please do not hesitate to contact Kenneth Kitahata at kkitahata@pcvmail.org.